
LTE Deployment in Nigeria.
Many Nigerian cities and some rural areas now have LTE coverage from one or more of the major network operators, Globacom, MTN, Airtel, and 9Mobile.
We continue to provide the public as well as interested network operators a level of visibility into the quality of LTE access in the country. This remains very important as mobile networks remain the primary source of internet access in the country. For small businesses, particularly those with international contacts, the quality of internet access can be a deciding factor between surviving and thriving. Independent reporting of the quality of these networks provides the operators with additional incentive to maintain or improve the quality of their networks.
In 2020 we added features to our mapping tool that allow interested network operators to perform first-level analysis of the basis for our RF quality maps. We also developed a proprietary Android-based mobile application for logging relevant indicators of the quality of LTE RF deployment to facilitate nationwide coverage of our quality reports. Now, data from our National Independent Wideband Quality Reporting (NIWBQR) is only one source for our quality maps. Enextlog, our mobile app logging tool, will become the predominant source in time.
The combination of our Enextlog and our mapping service (Emetrics) offers a unique independent platform for visualizing the quality of mobile broadband networks in Nigeria. Such unbiased quality reporting is of immense importance for broadband development in the country. As the saying goes, you cannot improve what you do not measure. While reports from network operators are helpful, they are no substitute for independent reports. The fact that the network operator rates its network the best is no consolation for a subscriber experiencing voice fading away every two minutes and voice frames dropping or being played back sporadic seconds after the expiration of their useful contribution to a live voice call. These are some of the consequences of poor network quality often suffered by subscribers. The subscriber whose very livelihood depends on reliable internet connection needs unbiased quality reports. That is what we offer.

Fig 1. EnextLog

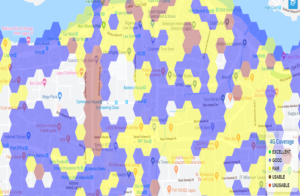
Fig 2. Public Emetrics
Our platform also helps the network operator to visualize the quality of the physical link of 4G LTE (and 5G) networks as seen by the subscriber’s equipment which usually translates to the quality of service experienced by the subscriber. It is independent. It serves these purposes:
- Making sure that the required level of attention is paid to the quality of the LTE physical connection provided to subscribers for internet access.
- Showing interested service providers areas where subscribers are most likely encountering poor connectivity, and providing measurement results to assist in identifying the causes and resolving the issues.
- Assisting the network operators in generating additional revenue by offering the highest possible data throughput as a result of improved quality of the physical link.
For the above reasons, our platform is not just for benchmarking. It is an avenue for improving and expanding mobile broadband penetration in Nigeria.

Fig 3. Emetrics
Below are the links to the various reports:
NIWBQR: National Independent Wireless Broadband Quality Reporting.
The reports are based on the ranking of the quality of the physical link of broadband LTE service provided by the four major mobile network operators. We subscribe to the broadband LTE service of each operator. We establish sessions of small data packet transmission for measurement of latency and continuous data transmission to and reception from the same FTP server located in the United States. We use a top-of-the-line data collection tool to log the messages and signals generated by each mobile device to evaluate the quality of the connections. We assign rating numbers to the deficiencies in the quality of each connection based on characteristics such as connection setup failures, connection drops, low peak physical layer throughout relative to the channel bandwidth, and prevalence of very low throughput bins (throughput lower than 500 Kbps, for example). We rank the networks first to fourth with the network with the lowest number being ranked number 1 and the one with the highest number 4.
https://enextwireless.com/ikeja-december-2020/
Public Emetrics: This started out as web-based mapping of the quality of the physical link of LTE connections used for our NIWBQR. Enextlog is not a substantial source of data. It is based on indicators of Radio Frequency quality such as signal strength (Reference Signal Received Power or RSRP), signal quality (Reference Signal Received Quality or RSRQ), and SINR (Signal to Interference plus Noise Ratio). Our algorithm derives from more than a decade of experience evaluating the RF quality of LTE networks. It classifies the average measurement of these signals within a 100-meter bin into Green for Excellent, Blue for Good, Yellow for Fair, Saddle Brown for Usable, and Red for Poor. The combination of RSRP, RSRQ, and SINR for each bin is displayed upon selecting the bin. The purpose of this map is to give the public a general sense of the quality of the physical link. While it is not a direct prediction of the quality of experience a subscriber might have, it allows the subscriber to see where poor quality of the physical link might be a reason for poor quality of experience. The URL is shown below.
https://metrics.enextwireless.com/
Emetrics for network operators: This is web-based mapping similar to Public Emetrics but with additional selections that allow the mobile network operator to identify the contribution made by each of the three measured quantities (RSRP, RSRQ, and RS SINR) to the overall rating. By plotting only the RSRP, for example, the network operator can see the RF coverage level. If the signal strength is good enough, then the RSRQ should be good if RF is optimally deployed. Selecting RSRQ will show this. SINR is the raw measurement that is used to determine the physical downlink throughput for the connection. Usable RSRP should result in good SINR. The SINR plot can be used to identify areas where this is not the case.
We have recently added other selectable measurements to this service. Now, the network operator can display ping packet latency and downlink and uplink throughput. Furthermore, the last date bin data that was updated is now displayed as well.
The URL is shown below.
https://metrics.enextwireless.com/enterprise/home.php
Note: An operator must request access to this URL. The access is currently free of charge. Once access is gained, all network operators are viewable by selection.